
Introducing Nectari 2022 R1. This release brings you some highly requested features to help you on your journey of becoming self-sufficient with analysis and reporting. With 2022 R1, you get optimized workbooks, customizable worksheets, new data connectors, and much more. Let’s jump right in.
Watch the 2022 R1 End User Webinar here.
Optimized for where you work. Introducing the Web Workbook.
With the release of Nectari's Web Workbook in 2022 R1, we're bringing you the power of the Excel Add-In and so much more. You can now access and view your workbooks on any device without opening a second application. You can also view your workbooks from your mobile phone and Mac computer, which you can’t do with the Excel Add-In. Get all your analysis and reporting done in one place – Nectari. Create your report, add images, export copies to Excel, or share with colleagues while maintaining your layout and user permissions.

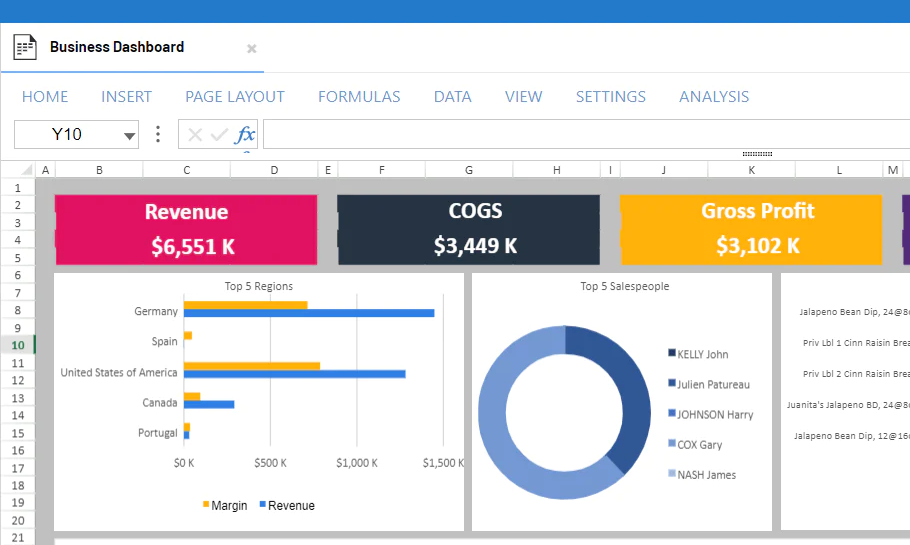
Build dynamic dashboards from your workbooks.
Smart caching
With the first phase of the cache in the Formula Wizard, an AI-based caching system analyzes your formulas in real-time and optimizes your workbook for you, so you don’t have to. This saves you the manual work of configuring your references and caching. Comparing different data sets is also easier. With the Excel Add-In, you must log in multiple instances to open the same workbook. Using the Web Workbook, you log into Nectari once and open the same workbook several times. That’s it! And because all open workbooks share the cache, they can now load faster.
Easy filtering
Do you want to see the sum of all transactions for a specific region greater than $10K from June last year until June this year? Using the new filtering options in the Formula Wizard, you can add multiple filters and filter groups to get as granular as you like. You can start by selecting your dimensions and measures using the search bar instead of scrolling down a long list of options, then use any of the new operators (check them out below). With the new filter options, you can add more complex filters to calculate things like 12-month rolling and link them to other filters with “and” “or” conditions.

Build complex filters to find exactly what you’re looking for.
Dynamic Global Variables
Any Global Variables created, like Current Month or Current Year, can now be added to any cell in your worksheet and referenced in your calculations. Instead of manually adjusting the cell’s value when you access your workbook, the cell gets updated automatically. For example, if your Global Variable is your current month, then every cell that makes reference to that Global Variable will be updated to the current month’s results when you open your workbook.

Add your Global Variables with a few clicks.
More exciting features
Enjoy new formatting features to help you customize the look of your worksheet. Now you can create different drop-downs with the click of a button. And no formulas or reference lists are necessary to change a cell to something like a Date Time Picker, Color Picker, or Slider. You can even link a Checkbox List to your data and watch your visualizations change as you select and deselect items from your list. This is just a sneak peek of some of the cool formatting features available in the Web Workbook that continue to be developed and will be complete in a later release.

Cell type options.

Cell Dropdown options.

An example of a Checkbox List created to filter based on the Facility.
Hassle-free upgrades
Administrators rejoice! Upgrades are now a breeze. Once you upgrade your server, all users will have access to the latest Web Workbook version, and you won’t have to upgrade each workstation individually. Web workbooks can be accessed within Nectari and viewed anywhere, from any browser.
Stay tuned!
Here are some of the next features that will be added to the Web Workbook in a future release:
- Data Extraction Wizard
- Smart Cache Level 2
- Selection Page
- Distribution
- Drill-down
- Pivot Wizard
Build your worksheets, your way.
The new column formatting features in the Nectari worksheets view allow you to customize your worksheets without making any changes in the backend that can affect the original worksheet design. This gives you more power to format your worksheet in the best way to tell your story.
Aggregating data
You can now summarize your data any way you like without impacting the Data Model Designer in the backend. Change how you view aggregated data and select from aggregate functions like Average, Minimum, Maximum, and Count distinct rather than only seeing the default, Sum.

More options to aggregate your data.
Define your style
Change your Groups’ and Columns’ formatting by applying different formatting to a worksheet’s header, content, and total row. Once a style is created, it can be copied and pasted into another column in the current worksheet or another open worksheet in Nectari.
You can either change the format of a cell or a number. When changing the style of a cell, you can modify the background color, font, color, and whether you want to use borders. Numbers can now also display their matching currency symbol. For instance, if you want to see British Pounds you would use the corresponding currency symbol - £. You can even select to show a number’s units in thousands (K), millions (M), billions (B), and trillions (T).
All these changes can be made to individual columns, whereas before, the formatting affected the entire worksheet. Whatever styling you create can be exported and will also be visible when shared.

An example of column formatting using Count Distinct background colors, currency and display units.
Now embedded in Sage 300
If you're a Sage 300 user, you can enjoy easy access to your analysis and reporting tools with Sage Enterprise Intelligence (SEI) embedded in your ERP. Sign in once, with single sign-on, to access the information you need. Everything available on the standalone version of SEI can be visible on the SEI menu panel. This includes admin functions, dashboards, reports, the mobile version of SEI, and even the new Web Workbook! With the menu configurator, you can customize which SEI menu items you want to appear within Sage 300. Your insights are just a click away.
Move your data
Our team continues to build migration templates to help you move your data from one ERP to the next without the headaches of mapping everything out from scratch. With these templates, you can get up and running in less time and keep track of any changes made during the migration. Here are the latest migration templates included in 2022 R1:
- Sage 200 UK to Sage Intacct
- Sage 50 to Sage Intacct
- Sage 300 to Sage Intacct
- Sage 1000 to Sage Intacct
- Sage 100 to Sage X3
- Sage 300 to Sage X3
- Sage 1000 to Sage X3
- Sage X3 (any version) to Sage X3 v12
Connect to more data sources.
We’re always adding new connectors to help you bring in more data sources and get a complete picture of your business. Here are the latest sources you can connect to Nectari:

Watch the 2022 R1 End User Webinar here.